Article
Trace SQL queries back to the code
Learn how to quickly find the line of code in your Hibernate application that causes a given SQL query.


Table of contents
Introduction
At some point you may have to find the line of code in your Hibernate application that causes a given SQL query. It can be for performance reasons, for example to solve an unwanted lazy-loading or an N+1 select problem. It can also be needed to debug a tricky persistence or transaction issue.
In this article, I will share a simple technique to pinpoint the line of code that causes the execution of a given SQL query. You don't need any fancy tool. It's only a matter of setting the right debugger breakpoint. Then it's up to you to fix the issue, but at least you will know where to start. I will show how to do it with IntelliJ, but any decent IDE will do.
Note that this technique works with any Hibernate application, so it is fine with Spring Boot and should be with other application frameworks.
Identify the SQL query
The first step is to identify the SQL expression of the query.
For a Spring Boot application, this is usually done by setting spring.jpq.show-sql to true in the configuration
and looking at the logs. Here is a short example:
Hibernate: select max(c1_0.id) from car c1_0Alternatively, you can set the hibernate.show_sql Hibernate specific parameter to true.
If you want to learn more about Hibernate logging or monitoring, you can read my dedicated Hibernate logging and monitoring guide.
Set the breakpoint
To find the line a code that caused the execution of the SQL query, we set a debugger breakpoint in
a low-level class that sees all SQL executed by Hibernate. This is what
org.hibernate.engine.jdbc.spi.SqlStatementLogger does. That Hibernate class is actually the one that logs
the Hibernate: ... messages.
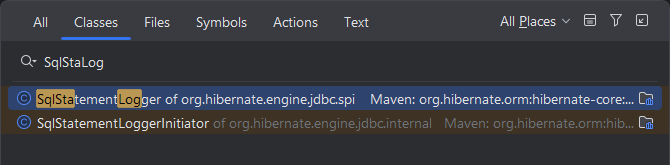
Open that class in your IDE. With IntelliJ on Windows, it can be done using Ctrl-N, then typing SqlStaLog
(no need to type the full class name).
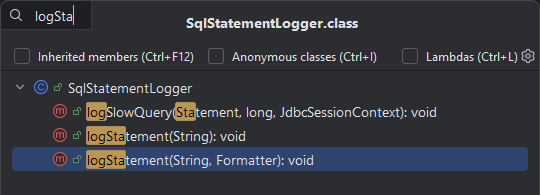
Go to the void logStatement(String statement, Formatter formatter) method.
With IntelliJ on Windows, it can be done using Ctrl-F12, then typing logSta.
Add a breakpoint at the first line of code:
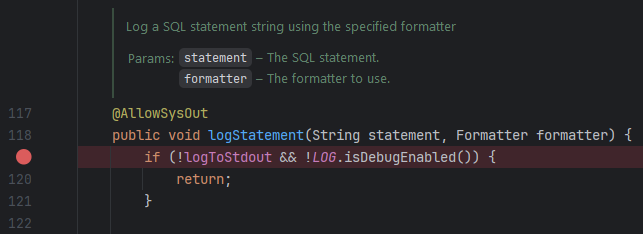
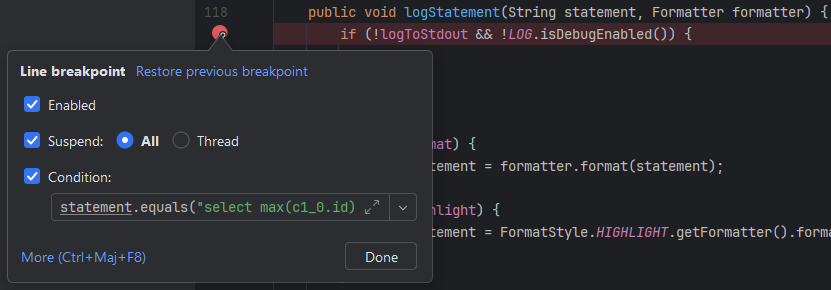
This breakpoint will be triggered every time an SQL statement is executed. We should narrow the breakpoint to our
specific SQL query by using a conditional breakpoint. With IntelliJ, right-click on the breakpoint, then input
the condition, for example statement.equals("...SQL query...") or
statement.contains("...part of the SQL query...") or whatever applies:
The setup is now complete.
Walk the call stack
We then need to run the application in debug mode and perform the business action that
executes the SQL query we want to trace. Note that at this point we do not even need show-sql to be enabled.
The breakpoint will trigger when the SQL query is executed. We now need to walk the call stack to find the line of code that caused the execution of the SQL query. From top to bottom, you usually look for the first method from your application code that is not a framework method. But it could be more complicated.
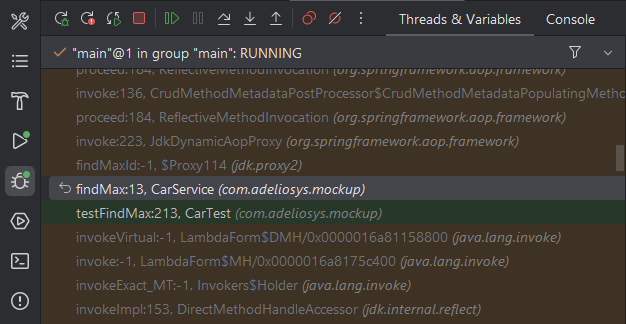
In my example, the SQL query was executed by the CarService.findMax() method, line 13.
Now I can decide what to do with it.
Conclusion
In this article, I showed how you can use a conditional breakpoint in SqlStatementLogger to pinpoint the line of code
in your application that executes a given SQL request.
I hope this will inspire you to hunt down and fix those SQL queries that have been annoying you for a while.
For additional practical tips for Spring Boot applications, you can read my Spring tips series.