Article
Hibernate logging and monitoring guide
Optimize and troubleshoot your persistence layer with Hibernate logs and metrics.


Table of contents
- Introduction
- SQL logging
- Slow queries logging
- Statement metrics
- Session metrics
- Session factory metrics
- Database connection pool metrics
- Conclusion
Introduction
Hibernate is a powerful ORM. It comes with several monitoring features such as logs and metrics/statistics. They can provide valuable insights of the behavior of the persistence layer, in order to optimize the application performances or troubleshoot mapping issues.
These features are available to applications that directly use Hibernate. They also run fine with high level application frameworks such Spring Boot (for example using Spring Data JPA) or others.
Many of these features are activated by setting the right Hibernate configuration parameters. They can be defined in
source files such as: application.properties (or YAML) from Spring Boot, persistence.xml from
JPA, hibernate.cfg.xml from Hibernate, etc.
This articles focuses on Spring Boot and will provide configuration samples for your
application.properties. To convert these parameters to standard Hibernate configuration parameters, simply
remove the spring.jpa.properties prefix. For example the standard Hibernate configuration matching
spring.jpa.properties.hibernate.format_sql is hibernate.format_sql.
Note that this article was written along with a demo application (see link in the conclusion) using Hibernate 5.6.11 (from Spring Boot 2.7.4) and 6.1.5 (from Spring Boot 3.0.1).
SQL logging
This is probably the most known and used monitoring feature. Hibernate can log all the executed SQL statements. Usually not recommended in production, it is very useful during development to review the generated SQL and identify persistence issues (N+1 select problems, unintended entity loadings, etc).
It can be enabled by setting the hibernate.show_sql Hibernate parameter or the
spring.jpa.properties.hibernate.show_sql Spring Boot parameter to true.
Or you can simply use the spring.jpa.show-sql Spring Boot shortcut:
spring.jpa.show-sql=trueA sample output:
Hibernate: select author0_.id as id1_0_, author0_.name as name2_0_ from author author0_If you prefer multi-line SQL logs, add the hibernate.format_sql Hibernate parameter:
spring.jpa.show-sql=true
spring.jpa.properties.hibernate.format_sql=true
The output is now:
Hibernate:
    select
        author0_.id as id1_0_,
        author0_.name as name2_0_
    from
        author author0_
Hibernate can also prefix the SQL statement by some comment (by default this is the HQL query, but it can be customized programmatically). It supports both single-line and multi-line SQL logs. A sample configuration:
spring.jpa.show-sql=true
spring.jpa.properties.hibernate.format_sql=true
spring.jpa.properties.hibernate.use_sql_comments=true
A sample output:
Hibernate:
    /* select
        generatedAlias0
    from
        Author as generatedAlias0
    where
        generatedAlias0.name=:param0 */ select
            author0_.id as id1_0_,
            author0_.name as name2_0_
        from
            author author0_
        where
            author0_.name=?
The previous logs do not integrate with the logging framework, meaning that no timestamp or thread name is logged.
If you prefer the SQL logs to integrate with the logging framework, the configuration is a bit different. It does
not use persistence related configuration parameters, simply set the org.hibernate.SQL category to
DEBUG in the logging configuration. For Spring Boot this is:
logging.level.org.hibernate.SQL=debugA truncated (I replaced parts of the SQL statement by ... for brevity) sample output:
19:19:26.720 DEBUG [nio-8080-exec-1] org.hibernate.SQL : select ...These integrated logs also support hibernate.format_sql and hibernate.use_sql_comments parameters.
The parameters of the SQL statements can also be logged. This requires some logging configuration that depends on the Hibernate version. For Hibernate 5 (used by Spring Boot 2.x):
logging.level.org.hibernate.SQL=debug
logging.level.org.hibernate.type.descriptor.sql.BasicBinder=trace
For Hibernate 6 (used by Spring Boot 3.x):
logging.level.org.hibernate.SQL=debug
logging.level.org.hibernate.orm.jdbc.bind=trace
A truncated sample output for Hibernate 5:
19:34:55.163 DEBUG [nio-8080-exec-2] org.hibernate.SQL                        : select ... where author0_.name=?
19:34:55.163 TRACE [nio-8080-exec-2] o.h.type.descriptor.sql.BasicBinder      : binding parameter [1] as [VARCHAR] - [Tolkien]
For Hibernate 6, the logs are a bit different but contain similar information.
Slow queries logging
Hibernate 5.4.5 and higher can selectively log the SQL statements that last more than a certain duration. This is useful to identify the slow queries of the application, for example because of missing indexes.
It can be enabled by setting the hibernate.session.events.log.LOG_QUERIES_SLOWER_THAN_MS Hibernate
parameter to the target duration in milliseconds. For example to use a threshold of 100 milliseconds:
spring.jpa.properties.hibernate.session.events.log.LOG_QUERIES_SLOWER_THAN_MS=100A truncated sample output:
19:37:21.128 INFO [nio-8080-exec-2] org.hibernate.SQL_SLOW : SlowQuery: 137 milliseconds. SQL: 'HikariProxyPreparedStatement@1736163819 wrapping select ...'This can be very useful in production.
Statement metrics
Hibernate can provide various metrics: statement metrics, session metrics and session factory metrics. The statement metrics log the duration (in milliseconds) and the number of returned rows for each SQL statement.
To get any of these metrics, we first enable the Hibernate statistics, by setting the
hibernate.generate_statistics Hibernate parameter to true, then enable the right Hibernate
loggers. For example to log only the statement metrics:
spring.jpa.properties.hibernate.generate_statistics=true
logging.level.org.hibernate.stat=debug
logging.level.org.hibernate.engine.internal.StatisticalLoggingSessionEventListener=off
A truncated sample output:
17:32:31.415 DEBUG [nio-8080-exec-3] o.h.stat.internal.StatisticsImpl : HHH000117: HQL: select ..., time: 4ms, rows: 1Note that this does not log all statements, for example the statements from the findById,
save, delete methods of your Spring Data JPA repositories will not be logged.
Session metrics
Hibernate can provide session metrics, also known as L1 (level 1) stats. This means that whenever an Hibernate session is closed, various metrics will be logged such as: JDBC connection usage, level 2 cache usage, etc. To do so, once again we enable the Hibernate statistics and enable the right Hibernate logger. For example to log the session metrics but not the statement metrics:
spring.jpa.properties.hibernate.generate_statistics=true
logging.level.org.hibernate.stat=off
logging.level.org.hibernate.engine.internal.StatisticalLoggingSessionEventListener=info
A sample output:
17:44:21.361  INFO [nio-8080-exec-8] i.StatisticalLoggingSessionEventListener : Session Metrics {
    26000 nanoseconds spent acquiring 1 JDBC connections;
    0 nanoseconds spent releasing 0 JDBC connections;
    119900 nanoseconds spent preparing 13 JDBC statements;
    1006100 nanoseconds spent executing 13 JDBC statements;
    0 nanoseconds spent executing 0 JDBC batches;
    0 nanoseconds spent performing 0 L2C puts;
    0 nanoseconds spent performing 0 L2C hits;
    0 nanoseconds spent performing 0 L2C misses;
    959100 nanoseconds spent executing 1 flushes (flushing a total of 10 entities and 4 collections);
    3300 nanoseconds spent executing 1 partial-flushes (flushing a total of 0 entities and 0 collections)
}
Of course, it is possible to log both statement and session metrics by enabling both loggers.
These logs contain useful information but may arguably be hard to read. Instead, it is possible to provide our own custom implementation:
- The Hibernate statistics are not needed, you may disable them or simply disable the default Hibernate logging of session metrics to prevent double logging
- Set the
hibernate.session.events.autoHibernate property to the FQCN (fully qualified class name) of our implementation, for examplecom.adeliosys.sample.CustomSessionEventListenerin the sample project linked in the article conclusion - Code that class using
org.hibernate.engine.internal.StatisticalLoggingSessionEventListeneras an inspiration - Make sure the log level used in the custom implementation is enabled
Sample configuration:
spring.jpa.properties.hibernate.session.events.auto=com.adeliosys.sample.CustomSessionEventListener
logging.level.org.hibernate.engine.internal.StatisticalLoggingSessionEventListener=off
The log is now more compact:
12:33:07.814 DEBUG [nio-8080-exec-5] c.a.sample.CustomSessionEventListener    : Session metrics:
    connections  : acquired 1 (46 μs)
    statements   : prepared 13 (112 μs), executed 13 (1117 μs)
    JDBC batches : executed 0 (0 μs)
    cache        : 0 puts (0 μs), 0 hits (0 μs), 0 misses (0 μs)
    flushes      : executed 1 (1020 μs) for 10 entities and 4 collections, executed 1 partials (5 μs) for 0 entities and 0 collections
The link to the repository containing the source code of this custom implementation is provided at the end of the article.
Session factory metrics
Hibernate can provide session factory metrics, also known as L2 (level 2) stats. They are useful to understand the
persistence operations that are executed over time, the most used entities, the most frequent or slow queries, etc.
Session factory metrics can also be enabled by setting hibernate.generate_statistics to true
or programmatically by executing sessionFactory.getStatistics().setStatisticsEnabled(true). Then you can
use the statistics API to get many information:
// To get the SessionFactory from the EntityManagerFactory, if needed
SessionFactory sessionFactory = entityManagerFactory.unwrap(SessionFactory.class);
Statistics stats = sessionFactory.getStatistics();
// The number of sessions opened by this session factory so far
long openedSessionCount = stats.getSessionOpenCount();
// The number of inserts for the book entity
EntityStatistics bookEntityStats = stats.getEntityStatistics(Book.class.getName());
long bookInsertCount = bookEntityStats.getInsertCount();
// The average duration of a query
String[] queries = stats.getQueries();
QueryStatistics queryStats = stats.getQueryStatistics(queries[0]);
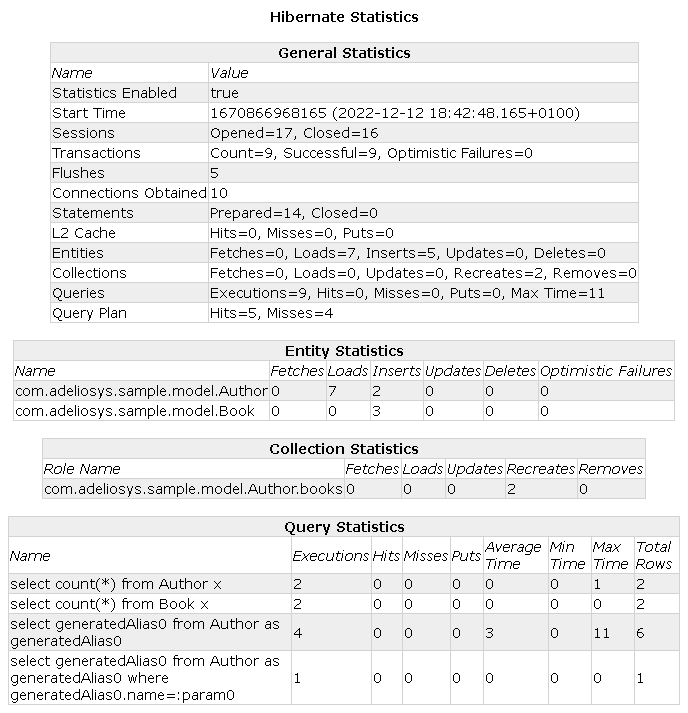
long averageDuration stats.getExecutionAvgTime();I often generate a simple HTML page that summarizes the statistics. Here is a snapshot from the sample project linked in the article conclusion:
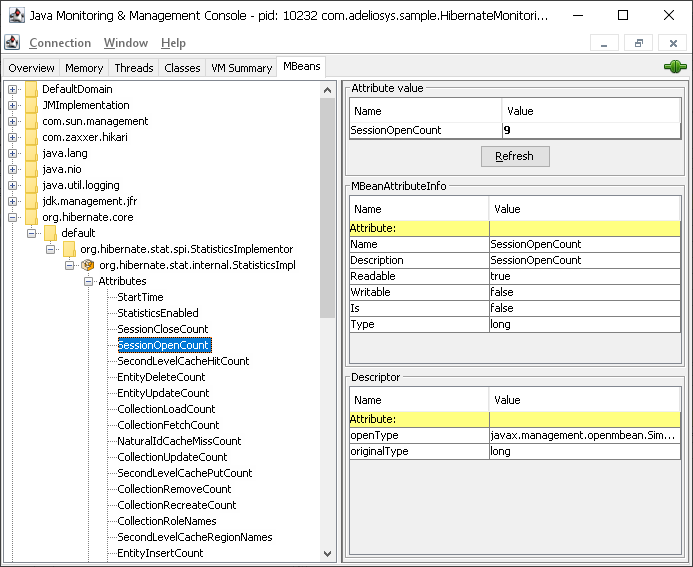
Hibernate can also expose the session factory metrics through JMX. Note that this is not supported by Hibernate 6.
To enable this feature, additionally set hibernate.jmx.enabled to true, then connect with
your preferred JMX client. A sample snapshot using JConsole:
Database connection pool metrics
Most database connection pool libraries provide usage metrics. This is actually not an Hibernate feature but it is closely related and can be very useful to tune the connection pool and prevent bottlenecks. Hikari, the connection pool used by Spring Boot by default, has an API to get metrics, for example:
// To get the Hikari data source from the data source
HikariDataSource hikariDataSource = (HikariDataSource) dataSource;
// The maximum number of connections, defined by the "maximumPoolSize" config param,
// see all config params in https://github.com/brettwooldridge/HikariCP
int totalConnections = hikariDataSource.getHikariPoolMXBean().getTotalConnections();
// The currently active (i.e. used) number of connections
int activeConnections = hikariDataSource.getHikariPoolMXBean().getActiveConnections();
// The number of threads currently waiting for an available connection
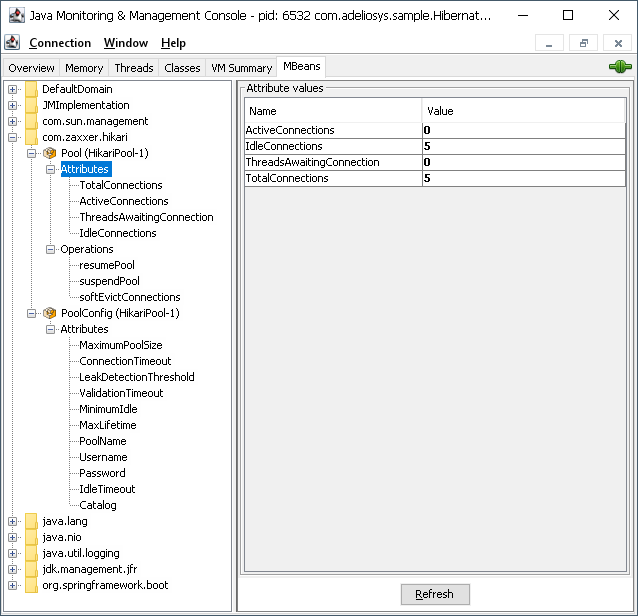
int threadsWaiting = hikariDataSource.getHikariPoolMXBean().getThreadsAwaitingConnection();Hikari by default exposes an MBean providing the configuration parameters (maximum pool size, idle timeout, etc).
To additionally expose the usage metrics (active connections, threads waiting, etc), make sure to set the
registerMbeans Hikari configuration parameter to true. When using Spring Boot this can be
done by setting spring.datasource.hikari.register-mbeans to true. Then from your JMX client,
the MBeans can be found under com.zaxxer.hikari:
Conclusion
We saw how to use several Hibernate monitoring features such as logs and metrics/statistics. They helped me troubleshoot and optimize the persistence layer of many applications. I hope they will help you too.
A sample project is available in GitHub, see hibernate-monitoring. The project README describes how to use the application.